Despite the fundamental importance of plates in Earth's mantle
convection, plates have not generally been included in numerical
convection models or analog laboratory experiments, mainly because
the physical properties which lead to plate tectonic behavior
are not well understood. Strongly temperature-dependent viscosity
results in an immobile rigid lid, so that plates, where included
at all in 3-D models, have always been imposed by hand. An important
challenge is thus to develop a physically-reasonable material
description which allows plates to develop self-consistently;
this paper focuses on the role of ductile shear localization.
In two-dimensional geometry, it is well-established that strain-rate
softening, non-Newtonian rheologies (e.g., power-law, visco-plastic)
cause weak zones and strain rate localization above up- and down-wellings,
resulting in a rudimentary approximation of plates. Three-dimensional
geometry, however, is fundamentally different due to the presence
of transform plate boundaries with associated toroidal motion.
Since power-law and visco-plastic rheologies do not have the property
of producing shear localization, it is not surprising that they
do not produce good plate-like behavior in three-dimensional calculations.
Here, it is argued that a strain-rate-weakening rheology, previously
shown to produce plate-like behavior in a two-dimensional sheet
representing the lithosphere, is a reasonable generic description
of various weakening processes observed in nature. One- and two-dimensional
models are used to show how this leads to shear localization and
the formation of 'faults'. This rheology is then applied to the
high-viscosity lithosphere of 3-D mantle convection calculations,
and the velocity-pressure/viscosity solution for the entire 3-D
domain (lid and underlying mantle) is solved self-consistently.
It is found that the lithosphere divides into a number of very
high-viscosity plates, separated by narrow, sharply-defined weak
zones with a viscosity many orders of magnitude less than the
plate interiors. Broad weak zones with dominant convergent/divergent
motion above upwellings and downwellings are interconnected by
a network of narrow weak zones with dominant strike-slip motion.
Passive spreading centers are formed in internally-heated cases.
While the resulting plates are not fully realistic, these results
show that self-consistent plate generation is a realizable goal
in three-dimensional mantle convection, and provide an promising
avenue for future research.
Complete 'Preprint' formatted paper available in PDF format, with embedded color figures or text only
(click on thumbnail to get full-size version)

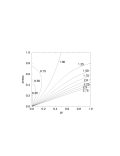
Figure 1. Relationship between stress and weak zone
width W for one-dimensional shear with various values of imposed
velocity V (marked on curves). (d) as (b) for visco-plastic rheology,
maximum velocity is 550. (e) As (c) for visco-plastic rheology.
Figure 2. Two-dimensional model of lithospheric and
asthenospheric shear, with Newtonian rheology (left) and SRW rheology
(right). Velocity (top), viscosity (2nd row), strain rate (3rd
row) and stress (bottom). A standard blue-green-red colorbar is
used, scaled to minimum and maximum values respectively.
Figure 3. Three-dimensional Case 1. (a) Temperature
isocontours 0.3 (blue) and 0.7 (red). (b) Lithospheric viscosity
and velocity vectors for SRW rheology. Viscosity ranges from 0.1
(violet) to 104 (orange), and the maximum velocity value is 670.
(c) Isocontours of horizontal divergence/convergence (±50,
light & dark purple) and vertical vorticity (±50, green
and blue) for SRW rheology.
Figure 4. Three-dimensional Case 2. (a) Residual temperature
isocontours 0.15 (red) and -0.15 (blue). (b) Lithospheric viscosity
and velocity vectors for SRW rheology. Maximum velocity in the
domain is 780. (c) Isocontours of horizontal divergence (±50,
green and blue) and vertical vorticity (±25, yellow and
mauve) and for SRW rheology. (d) as (b) for visco-plastic rheology.
(e) As (c) for visco-plastic rheology. Horizontal divergence (±40,
green and blue) and vertical vorticity (±10, yellow and
mauve).
Figure 5. Three-dimensional Case 3. (a) Residual temperature
isocontour -0.15. (b) Lithospheric viscosity and velocity vectors
(domain maximum velocity is 302). (c) Horizontal divergence (±35,
green and blue) and vertical vorticity (±20, yellow and
mauve).
Figure 6. Three-dimensional Case 4. As Figure 5 except
(a) Residual temperature isocontours 0.15 (red) and -0.15 (green),
domain maximum velocity is 2030. (c) Horizontal divergence (±200)
and vertical vorticity (±150).